Time and Energy to Solution
Starting with HEP Benchmark Suite v3, sites can record the electric power consumed while running HEPScore23. Combining the performance score with the measured power lets us reason about two quantities that matter for procurement and operations: how long a workload takes (time to solution) and how much energy it consumes (energy to solution).
The data behind this page come from the same dataset as the HS23 score table — only the configurations that report electric power are shown.
Why it matters
- Quantify the trade-off between processing speed and energy efficiency across server configurations.
- Establish a baseline for cost-benefit analysis that is independent of any single site.
- Enable full TCO estimates: individual sites can combine these models with their own (confidential) procurement and electricity costs to compute total cost of ownership internally.
Interactive plot
Each marker is one server configuration, positioned by its relative time to solution (x) and relative energy to solution (y). Both metrics are normalised to the fastest power-reporting configuration in the dataset, so that reference sits at (1, 1). Filled markers have SMT enabled, open markers have SMT disabled.
Hover over any point to read its full metadata (CPU, site, RAM, power, HS23 score and the derived metrics). Use the controls to recolour, filter by site or SMT, search for a CPU, switch between log-log and linear axes, or toggle the power-law fit. Click legend entries to show or hide groups, and use the toolbar to zoom, pan, autoscale or download a PNG.
Show static reference plot (HEPiX Spring 2026, Lisbon)
Static version of this analysis, as presented at the HEPiX Spring 2026 workshop in Lisbon.
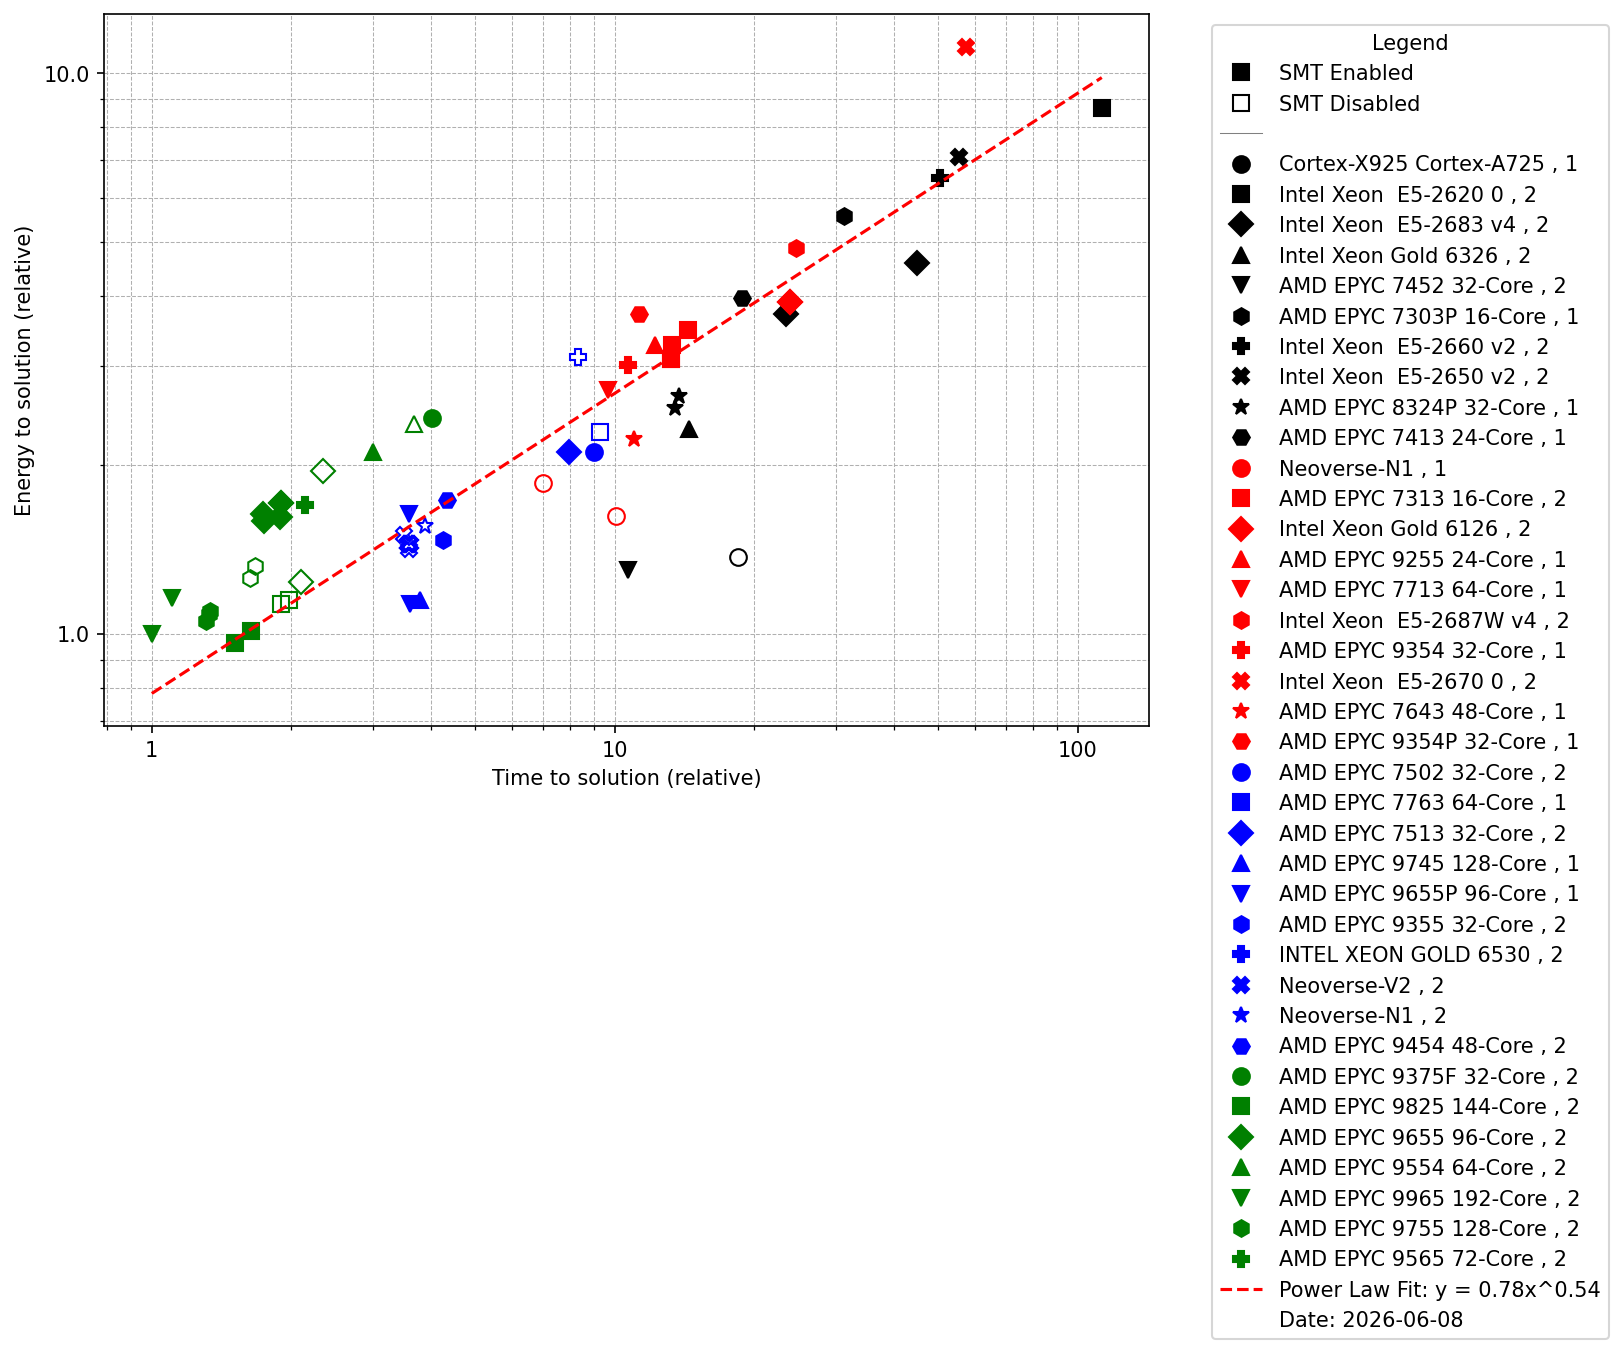
Source: HEPiX Spring 2026 Benchmarking Working Group report (D. Giordano, CERN).
How the metrics are defined
The two metrics are built from a few measured quantities: the number of events to process (TNevt), throughput (Th, events/second), electric power (W, Watts) and the HEPScore23 (a throughput proxy). Because throughput is proportional to HEPScore23, the relative expressions simplify to the HS23 ratios shown below.
| Comparison | Time to solution | Energy to solution |
|---|---|---|
| Absolute (server 0) | TNevt / Th0 | TNevt · W0 / Th0 |
| Relative to reference (j vs. 0) | ≈ 1 / HS23j | ≈ (Wj / W0) · (1 / HS23j) |
| Server-to-server (j vs. i) | HS23i / HS23j | (Wj / Wi) · (HS23i / HS23j) |
On the plot above, each point uses the relative to reference row, with the reference being the fastest power-reporting configuration in the dataset.